
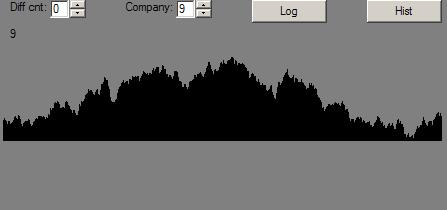
Here is a mountain range’s profile:
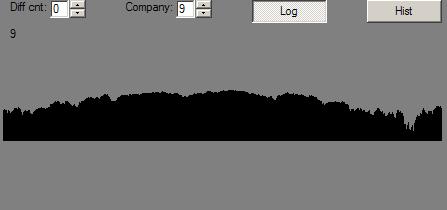
Or, if you prefer, displayed on a sorta biased log scale:
The mountain range is generated using a relatively standard fractal mountain range method:
- Starting with the whole range as a segment, divide the segment in half and move the middle of it up or down randomly from where it would be if it were on a line ‘tween one end of the segment and the other.
- Recursively do the two half-segments.
- But … pick smaller and smaller random movements as the segments get smaller.
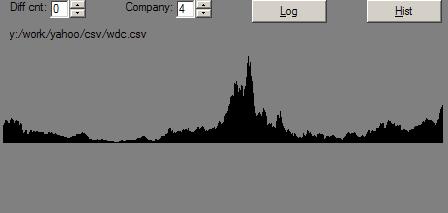
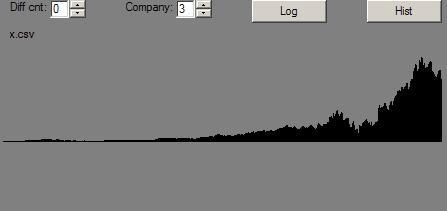
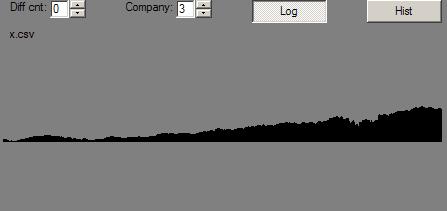
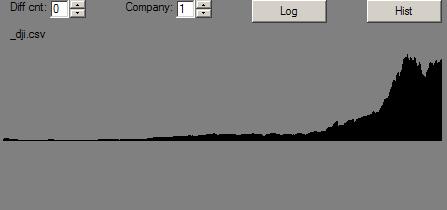
And, here’s WDC’s (Western Digital) daily price history, similarly displayed:
And, on a log scale:
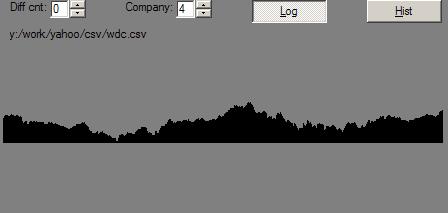
WDC’s price history is nice to work with because it is not very swamped by market movements.
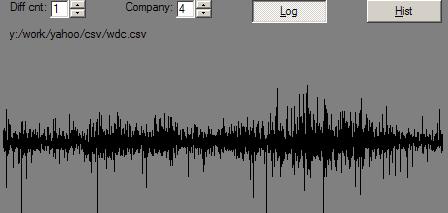
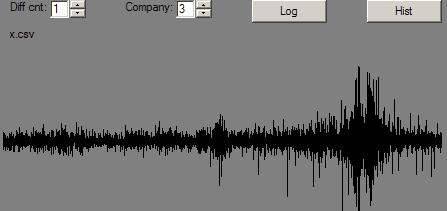
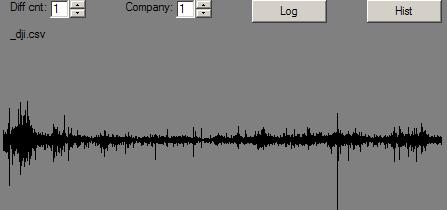
Now, what do relative daily changes look like for both:
Mountain range:
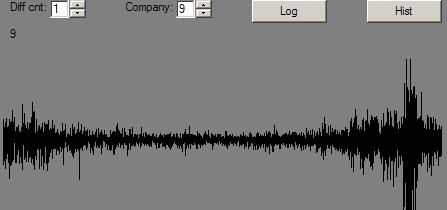
WDC:
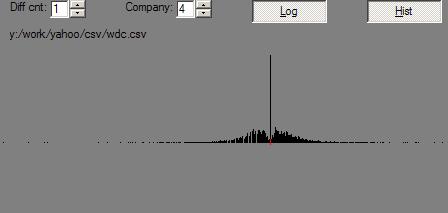
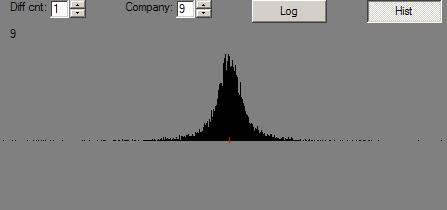
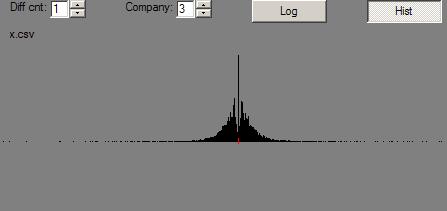
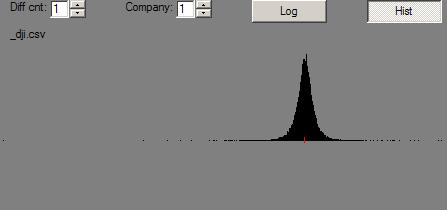
Here are the histograms of the changes:
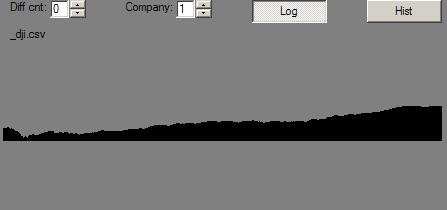
By contrast, here are the same pictures for MMM (3M) after its price has had the Dow Jones Industrail Average (of which it is a part) factored out:
And, here are the pictures for the Dow Jone Industrials, themselves:
So, aside from lots of pictures, what’s up?
Well, one thing that sure stood out: Relative changes went in to overdrive in the mountain range where there were valleys. Not nearly so for stocks.
That’s not news, but I’m asking myself some questions:
- Does the method I used for making the mountain range make bad mountains? There are notes on the net that suggest that the method I used is not really “correct”. Anyway, they sure look like mountains.
- Which way is it with real mountains?
- Is the eye normally fooled by mountain range profiles that have, in effect, oversized boulders in the valleys?
- Or, is the eye fooled in to thinking that an oversized-bumps-in-valleys profile is that of a reasonable mountain range?
- What about the ear? Nose? Etc?
Anyway, this particular difference ‘tween fractal mountains and stock prices is probably at least one reason why Mandlebrot turned to multi-fractals to try to generate values that look like stock price histories.
One thing I may fool around with: modulating the random up/down-ness of mid-points not by the size of the segment, but by another mountain range. That’s kind of working backward, as the next thing to do would be to modulate the modulator … and so on. Or, put another way, does the profile of the uncertainty of “the market” with respect to a stock look like a mountain range? And so on.
Anyway, again, this is getting a bit off the track. One good thing: if a simulation’s operations are underlain by intrinsic values that are mountain range data, and if the simulation creates stock-history-like data, then that’s a good thing. Presumably, pieces of the simulation’s logic can be turned on and off and it can be found which bits of logic are critical and which are not. Which is the idea.