
I got curious whether stock price behavior might be a consequence of some combination of buyers and sellers who had access to different information. Naturally, that sounds like a job for a simulation. Simulations are always easier than thinking. 🙂 And, they are sure better to learn with.
Anyway, somehow that got me looking at real stock market prices (thank you, Yahoo closing price history downloads). If I’m gonna simulate stock pricing, then it would be nice to know what the real thing looks like.
So far:
1) I pinged an email address on a web page to find out about available tools to detect whether artificial stock pricing looks like the real thing. Bust. He said his stuff was just some numbers he didn’t know about. The web site was about fractal stuff – including Mandlebrot’s stock market work.
2) When I graphed the histogram of relative changes to closing prices for some stocks and market averages, the older stocks had a curious oddity in them looking like this:
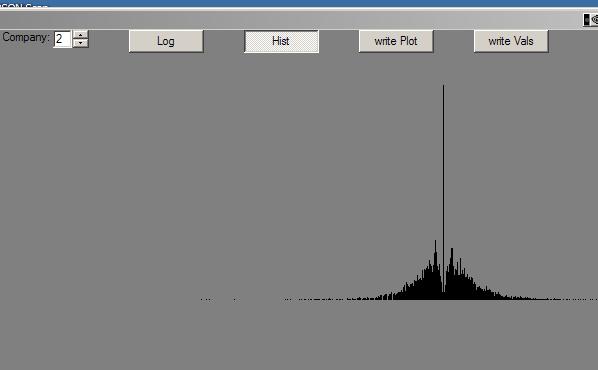
Note the crater at the center.
The crater seems to be caused by a combination of:
1) The numbers I’m using are normalized for stock splits – so old closing prices can be really small.
2) The numbers are rounded to the penny.
3) Before a few years ago, the smallest change in a price was a 1/16th (or 1/8th?) of a buck. If the resolution of the histogram is much smaller than that amount, then all the changes under 8 cents get rounded to zero – and are included in the tall spike at zero.
Anyway, I messed around, explicitely not using multifractals and variable time. And got some numbers that, when graphed in various ways aren’t too different looking from real stocks.
Time to press on and leave this distraction.
Ah. One thing thinking about a simulation does: It makes real clear what is pointed out (but often buried) in available information: The basis of value of all stocks is dividends. And, the ideal thing is to buy a stock when it’s worth pennies, and get a decent dividend when the stock is worth a lot. If you buy a stock for a buck and it goes to $100 and pays a 4% dividend, then you’re getting a pretty good payback on your buck even though the stock goes back to zero value in the end – which you want it to do from that $100 in a single day, of course. 🙂
Anyway, my plan is to create a bunch of stocks with a real value (dividends) profile that look like that mountain range. Then give some actors differing knowledge and/or disinformation of the future and let ’em go at it in a market.
And see what happens.