
Recently, a group down in Berkeley pulled together temperature measurements from all over the world for the last couple hundred years.
Their effort is notable in that they are publishing the source code and data. This novel idea of publishing the code and data is a very good thing. Thank you, ClimateGate.
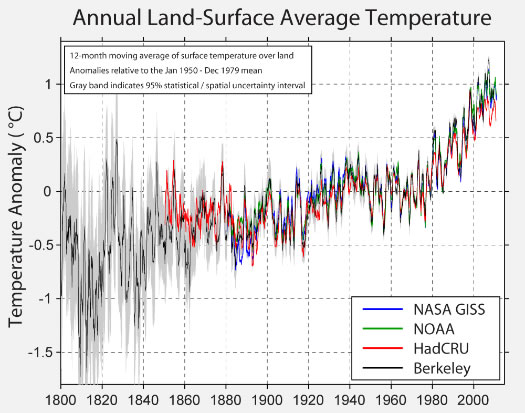
And they published their results in graph form:
The usual flurry of noise followed their press release.
I did not read of anyone asking the immediate question this graph raises:
What happened in 1975?