More Expected Characters

Now, it’s expected words.

Or, more exactly, after running the Buffet letters through a program that tracks strings of words (rather than characters), the last of a sequence of letters is shown with the words that are in common strings made small. And unusual words or strings of words are made big.

Common strings are small - uncommon strings are big

The effect is the same. Boiler plate paragraphs are small. New stuff is big.

Dirty Harry’s Balcony

Grey day. But, on the little Timber Trail up at the top of Highway 18 on Tiger Moutain, someone told me about the trail to Dirty Harry’s Balcony.

I’d wondered whether you could get to the top of any of the rock outcrops on the north side of I90 just east of North Bend.

Sure ’nuff.

Turns out, you take Exit 38, the 1st exit east of North Bend. You gotta drive on the old road east a bit past a state park, then under the freeway. Then stop. There, you either go back on I90 westbound, or you take the neat little road up and around to the fire department training grounds. The sign says that they close the gate at 4pm. It’s 5 when I cruise in. Gate’s open.

I explore the road. Small signs along the way. E.g “Pick you heros carefully.” “You own your reaction.” Even without the occasional full sized pickups and anonymous fleet vans, you can guess that this road leads to a world where they play for keeps.

See the trailhead. Measure the distance back to outside the gate. 0.6 miles. Ok. Park outside the gate, stroll back up the road, across the little bridge, up the hill to the trailhead:

Google Maps Note: Google Earth has a much better picture and a Google Earth Community link to the trailhead.


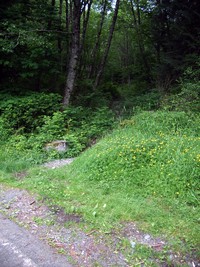
Dirty Harry's Balcony Trailhead

The trail is not a big thing. Just cuts off from the road – not as I think (apparently without a cap) straight back north toward Mailbox Peak, but rather, east up a steady, but unsteep slope.


Closer view of trail as it cuts off the road

Anyway, the trail is one of these straight-up-the-wash things. Kinda rocky. OK, though. Eventually, it hangs a Louie. That’s where the cutoff is for the Balcony. There is a little coil of that 1-inch, rusted, stranded cable you see so often in the woods. And, someone put a little streamer on a bush.

I try to take a picture of the cutoff, but the batteries are dead. … Yank the spares out. … Ooops. They don’t even light up the camera to tell me the battery is dead. What a drag. That means I’ll have to come back sometime to shoot the rest of the trail’s sights. Well, that’s ok, ’cause the left turn has me wondering. Is it another way to get up Mailbox? That’d be quite cool. Go up from I90. Go down the other side to the road/trail up to Granite Lakes. Miss the main trail completely. A real gonzo path, that would be.

Anyway, I take the cutoff and in a few hundred yards of some up, some down, last up, pop out on the Balcony. Top of the rocks, looking at a swirly I90 going east. (The depleted batteries spring back to life for a couple of pictures.)


View from Dirty Harry's Balcony over I90

And, looking back up the rocks toward the east end of MailBox Peak:


View up toward Mailbox Peak from Dirty Harry's Balcony

It’s a bit humid. Close to the low clouds. And, I’ve run out of Kirkland Sport Drink so there’s no reason to linger. I head back.

A bit back on the trail – maybe 50 to 100 yards – there’s a cutoff to the east. Someone has put a branch over the cutoff trail to indicate that it’s the wrong trail. Coming up the trail, the right hand trail turns and goes up to the rocks. The right-turn trail feels right. But, the blocked trail looks interesting. Maybe it goes over to more of the rocks to the east. Let’s see.

I follow it. It’s a real trail. Not a freeway. Looks like maybe it’s a trail used by rock climbers. Up, down, up, up. Ladies, leave your high heels at home. This trail feels very nice.

Eventually, it comes out in one of those open groves of ceders and such. You know the kind. Lots of needles and brown stuff all over. No undergrowth. The trail could be just about anywhere, since the whole area is walkable. I’m thinking, “Hmmm. If this ends up being a longer trail than I’ve planned, I could be coming back here under the LED light.” That’s not good. Even in the best of times, I tend to wander off trails – accidentally or on purpose. Makes no difference. And, I know from harsh experience that I have a real hard time keeping to vague trails running through areas like this open area – in the light. In the dark, it’s random walk time.

Oh well. Getting off the trail isn’t a worry until later.

“Later” is in 2 minutes. The trail came from the upper left area of the grove and, according to my best estimate, peters out somewhere in the upper right area of the grove. What to do? Go back? By Jove, surely you jest!

There are two alternatives:

  1. Go to the edge of the open area and look for where the trail leaves.
  2. Start heading down.

It’s a cinch that the trail goes out of the area about 50 feet from where I am, so alternative 1 is the clear choice.

I choose 2.

Why? Well, if I go with 1, then I’ll pick up the trail, continue along it, and maybe, in about 11-teen miles, get to some other trail from I90. Hungry. Thirsty. Tired. A long way from the car. … Or, I’ll need to come back on this trail – and get lost in the clear grove.

If I go with 2, then I have a chance to come down off the hill in a completely different way than how I got up.

Down we go.

After all, in this kind of forest, the going is pretty good. No brambles to whack through.

I follow it down. … And down. … And down. … Oh, oh. Climbing back out of this thing is not an appealing prospect.

So, down we go some more.

Ah, I hear a stream. Good. Worst case, I can always follow the stream down to I90. Unless it goes over a waterfall. Then I’ll need to improvise.

Well, luck stays with the innocent.

Sure, it’s steady going through moss-on-rock-and-rotten-wood. And, sure, it’s one of those places where there is always a much clearer path about 20 to 50 feet to the left – or right – either one. Take your pick. They both look better than the raggity place you’re in.

Sure, after a couple of slips, I’m glad that I’m wearing old jeans rather than the nice, white pants I so often wear hiking.

No Tarzaning to be done, no vertical stuff, just easy going.

And, you can’t get lost on a steep hill aimed at the sound of Interstate Waterfall.

Score! No brambles at the bottom. Old, old road, completely overgrown by wildflowers. Little building of some sort connected to the shoulder of I90 by a dirt “road”.

Dang. No old road back to the car. Walking on freeways is no fun. Loud. Loud. And, gosh, cars really boogie along nowadays. Not like when we were kids.

And, woe is me:

Exit 38
1 Mile

That’s when I realize that my thinking about the direction of the main trail had been wrong. It was a long trudge back. Soaked pants and shirt from the mist and wet grass.

And, the Gold Honda has “emergency” clothes. So, I step in to ’em in under a light June rain.

The gate was still open at 7:30 as I drove away.

All in all, if you gotta dig in to your emergency gear, it’s been a great walk.

Data Compression

I count three ways to compress data:

  1. Make common quantas of data short, uncommon ones long. e.g. Huffman encoding. I, am, not, be, a, or, prestidigitation, gesticulate, onomatopoeia, redundant.
  2. Reference known data. e.g. Symbols. ZIP file encoding of references to repeated byte strings. Refer to a whole book’s worth of information by referencing the title. One if by land, two if by sea.
  3. Drop information that is not needed. e.g. JPG images. MP3 music. Forget it all. Don’t do it.

Are there any more?

In a sense, all optimization is data compression, is it not?

Sony Network Walkman MP3 Player

Through an untold story involving serial ports I aquired a Sony Network Walkman flash memory digital music player. NW-E507, serial number 1329621. 1 Gig of memory. FM radio.

Why you want it:

  • Battery life is infinite.

Why you don’t want it:

  • Plays only ATRAC, klunkily converted by a PC program from only MP3, WMA and WAV formats.

Detailed look – while the grass grows tall and the battery drains:

To use this device, you must install Sony’s XP/Mac CD SonicStage program. SonicStage’s purpose is to sell you music. But, you are forced to use it to convert and transfer music to the device. SonicStage is also a music player, CD ripper and burner, etc. Since you already have 11-teen of each of those, SonicStage is redundant – of negative value. Knock 30% off the device value.


Update! Turns out that there is a simpler program available for download at Sony’s support site. But, then, that program, an MP3 transfer program, which is installed to a directory on the device itself, has simple instructions describing a control screen that does not seem to appear on my PC. The program, as it runs on my PC, allows only browsing the device and deleting content. So, the program is worthless on my system.

The device apparently does not play MP3 files (nor OGG files). SonicStage slowly converts MP3 files to Sony’s proprietary ATRAC format (I guess) before it copies the files over to the device. Be prepared to leave the device copying while you do something else, if you are filling up the device’s memory. There may be a way to pre-convert the files that you’ll want on the device later. Or maybe not. I can only guess that the ATRAC format gives the device its strong point: battery life. Otherwise, we’re talking negative value here, relative to a device that allows you to drag and drop or DOS-copy files over directly.

<RANT>Given that adding OGG file support to SonicStage may take a day or two of engineering time, it’s hard to fathom the downside of such a capability. Heck, given the cost of OGG and/or FLAC file support, one wonders how Sony could not sell enough extra devices to pay for the feature-add. But, there you have it.</RANT>

In any case, files take room similar to MP3 files: i.e. 5 meg per song. I got only about 190-210 files on to the 1Gig device. Ouch. If they had been negative one quality OGG files, then my whole “card” list (all 600+ songs I can listen to at any time without displeasure) would fit on the device. OGG files of walking-around quality can be 1.2 meg per song – 800 songs on a 1Gig memory card, playable on the Palm. SonicStage has settings for quality, I believe. I will fool with the settings to find if ATRAC can withstand OGG-like compression.

At least one file I transferred could not be played. It was an MP3, 11k sampled, 16-bit mono. Where was SonicStage’s conversion logic?

The manual is shipped as a PDF file. Unfortunately, it’s buried on the CD and installed to the hard drive somewhere obscure enough for me to have used an abominable shell program to view it. The manual is wordy and picturey to the point of confusion. It contains the same picture and words over and over and over and over and over again. For each menu option.

It is physically possible to read the manual and find out what you need to know.

The device UI is of the vaguely Japanese style.

You’ll need the operator’s manual to tell you how to kick the device in to “shuffle” play mode. (Unless you really, really want to explore the Walkmen Cavern.) And, the manual explains the meaning of some cryptic options in the unlikely chance that you may want to use them.

Which gets to specific UI nits:

  • The play order starts over again at the first song after the device is connected to the PC.
  • The shuffle (random) play setting is not persistent. You gotta kick it back in to shuffle mode after any connection to the PC.
  • The jog dial has a bad feel when it’s used to fast/skip forward/reverse. Especially reverse. Someone didn’t tune the feel of skipping to the previous song. I’ll admit that this tuning isn’t easy. I wrote such code myself in a player program and it takes more than a few minutes of testing to get right. Too, in shuffle mode track-reverse apparently doesn’t even work! It would seem that the programmer could not find 200 bytes of memory to store a reasonable past-play list. Or could not build a reversable PRNG.

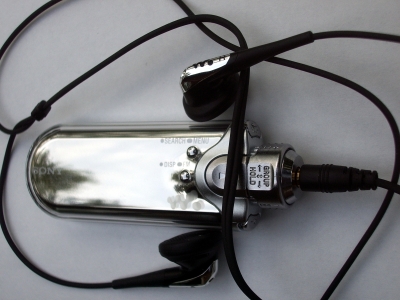
Front side of Sony NW-E507 Large image Front side of Sony NW-E507 Large image

But, the UI isn’t so bad.

There’s a play/pause button that’s intuitive. Push it to play. Push it to pause. 🙂

There are two volume buttons on the shoulders.

There’s a jog dial, push-pull switch that has 3 push-pull positions allowing 3 modes, two of which are “control the device” and “hold – ignore the buttons”. The third position is apparently, “what was in the mind of our ADHD designer the day the UI was spec’d”.

There are a couple of other buttons that rely on either normal-press or press-hold to access a menu or to change the display/play mode, depending upon the button.

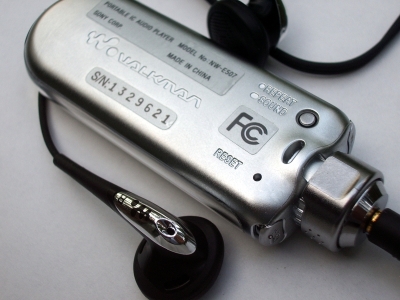
Back side of Sony NW-E507 Large image

There is a secret, almost recessed button on the back that you’ll need to use ’cause Sony’s engineers could not find a way to add a couple of items to the UI’s main menu.

And, there’s a working Reset hole on the back. I needed it ’cause the firmware update to v2 didn’t take – twice – before I gave up.

The screen is OLED, hidden behind a good-old-boy, silver reflective sunglasses look.

The whole device is a like a slightly large and heavy USB flash drive. Solid and nice feeling.

It sounds real good. The little ear-bud headphones are good – like modern headphones of all prices and types. And comfortable.

There is no equalizer. Base/treble control with two presets available. That’s good, in my opinion.

The FM radio received some stations ok out here in the sticks.

Battery charging is done through the USB connection – using a standard mini-USB plug on the tail end of the device under a rubberish cover that will probably disappear with use. I used a Palm TE cable already plugged in to my PC.

The device can be used as a USB drive.


So, folks, here are my current alternatives:

  • Korean MP3/OGG player (256 meg, AAA battery)
  • Palm Tungsten TE with PocketTunes playing OGG files off a 1 Gig SD card.
  • Sony 1Gig ATRAC player

The Korean MP3 player has 1 problem: a single AAA battery lasts only one and a half hikes. And, for gosh sakes, I can’t find any of my old rechargable AAA batteries. Since the Korean device plays OGG files, it’s easy to randomly copy a subset of my “card” files to the device using a shuffled .BAT file. I do that once every couple hikes to get a new 170 song random subset of the 600+ songs.

The Palm’s problem is its battery, too. The bright color screen drains the battery half way in to a long, eBook-reading hike. Playing songs would shorten that time. So I carry the MP3 player. Music and forest go well together. Anyway, the color TE is inferior to the dead M500, which could not play music. Someday, I may return to an M500. Who knows?

The Sony sounds better than the other two devices. (Negative 1 quality OGG files are detectably inferior to normal OGG/MP3/ATRAC. The Palm gets kinda busy at times and can glitch.) If the Sony’s battery lasts forever (effectively), then the Sony may be superior to the other two. I can imagine a way to gimp SonicStage to get the device loaded in a usable way. And, if ATRAC can acceptably compress file to sizes touted on the Sony’s box, then – OK.


Battery story:

This device has battery life that just won’t stop. I played the device for 16 hours and the battery indicator showed maybe 80% full. Then, I connected the device to the PC for a couple of minutes while installing the MP3 program. The indicator zinged up to a hair (maybe) under full.

If you have a USB hub, be it in a PC or be it standalone, then this device has a battery “feel” like the early Palm devices – simply not even something you think about. Unless you play this device 16 hours a day and simply hook up the USB every day or 3, it’ll be so long ‘tween charges that the real problem will be forgetting to charge it at all!

Japanese Style User Interface Design

Over the years, I’ve noticed that Japanese devices have a unique style of UI.

What’s that, you ask?

They present a Colossal Cave Adventure Game to the user.

They idea behind Japanese UI, it seems, is to give the user a rich world to explore. “Look what I found!”

Lots of “You are in a twisty maze of passageways, all different” ness.

Lots of options. Not just a lot of options in simple lists, as one would expect an out-of-control engineer to create, but rather modes, tricks and cross-connect dependencies galore, each affecting available options.

Presumably, the device has fulfilled its function when the user fully explores the device’s UI. That done, the user tosses the device and gets something new.

Tracking a portfolio relative to the market

Well, I’ve built a web based front end to portfolio_track.py.

The idea is to track how well a stock portfolio is doing against a market average.

The front end uploads a text file and slowly presents an HTML listing of the output of portfolio_track.py.

For “the market”, the web front end uses the S&P 500, no fees and dividends.

Other market averages have, in the last couple of years, done slightly better than the S&P. But we’re talking a couple percent, maybe. Not enough to write home about.

This is all real fun, of course, since my own portfolio’s printout shows I’m a genius. Maybe some time soon I’ll be a dunce and won’t spend so much time printing numbers to make myself feel secure in genioushood. 🙂 After all, if you read something (or hear it, or whatever), you’ll believe it. … Yet another reason to send yourself hundreds of spam emails a day telling yourself that others are getting huge fun from whatever it is you should be doing.

Expected Characters

After reading all the Buffett yearly letters it sure seemed like a good idea to experiment with programs to help read repetitive stuff – stuff containing lots of boiler plate, for instance.

So …

There are lots of ways to address the issue. I did something with assembling a large tree that could represent a Markov Model of the text. That took a lot of memory and a lot of CPU. And, things get very interesting when it comes time to prune the tree. More work to be done with that.

Meanwhile, there’s a really quick, easy way to play with this sort of thing:

Starting with, say, 10 documents, ordered in some way, “read” the first 9. Build a memory of sub-strings of the 9 documents. Then display the 10th with each character rendered in a font size that represents how well it’s expected to be at that position in the document. In particular, render “surprising” characters big and “expected” characters small.

Well, without going in to details of the current code in random_byte_strings_in_file.py, here is an example paragraph from the Buffett 1999 letter processed with data from the ’77 through ’98 letters:

Paragraph of Buffett 1999 letter

Ugly.

But, nice try.

Hmm. Well, let’s note how the script works:

It stores a big dictionary/hash keyed by unique strings. The hash’s values are the number of times the string has been found in a document.

For each document the script reads, it picks lots of random characters in the document.

For each random character, it remembers strings in the document that include the character. It does this by, first, storing the character as a string. Then it tries to extend the string on both ends, continuing to store strings until either a new string is stored or some limitation is reached.

To process the last document, the script uses the string:value hash table to assign a numeric value to each character of the document. I’ve experimented with several ways to do this. They all lead to words that look like kidnappers created ’em.

There are, of course, a gob of ways to make the output more visually appealing, if not usable.

But, what the heck. Another interesting thing I’ve not done is to convert the output font sizes to audio samples and listen to the thing.

One wonders, for instance, whether the ear can distinguish between various texts. But, then, recognizing the differences between writings of, for instance, one person and another, is an old story – and there sure are better ways to do so than this rather round-about scheme.

Picking Stocks with a Dartboard

Well, I keep looking for bugs in portfolio_track.py – seeing as how it tells me I’m a genius stock picker.

I don’t trust programs that try to butter me up.

Especially those I write, myself.

But, unfortunately for my sense of peace, while fortunately for my wallet, those bugs just don’t seem to be easy to find.

Anyway, it got me thinking about converting the output of portfolio_track.py from what it tells: how you’re doing against a market average – to how you’re doing in percentiles of possible “market” investors. That is, if, say, 100 people dartboarded the market average’s stocks, how many of ’em would you do better than?

So, since God made computers to save us having to work for a living, let’s find out…

Let us, for instance, take an S&P 500 list of stocks (as of sometime late last year), and buy 15 of ’em at random a year ago. Then sell ’em today. Do that 100 times and tell us a distribution of the results:

From: 21-Apr-05
To:   21-Apr-06
Multiplier: 1.0
Percentile Distribution
 1   5.5   5.5
 2   9.7   9.7
 5  12.9  12.9
10  15.4  15.4
15  18.3  18.3
20  19.7  19.7
30  21.9  21.9
40  22.9  22.9
50  25.6  25.6
60  27.8  27.8
70  30.5  30.5
80  34.4  34.4
85  36.1  36.1
90  38.1  38.1
95  40.1  40.1
97  43.1  43.1
98  44.7  44.7
99  47.5  47.5

To explain: the line, “98 44.7 44.7” tells us how the portfolio in the 98th percentile did. It gained 44.7%. His equivalent on the dunce side gained 9.7%. And, the average portfolio was up around 25%.

There are two percentages printed. The first is the second multiplied by the “Multiplier” – a factor that makes the first percentage normalized for a 1-year period.

Well, that’s all real cool, execept that the real S&P 500 was up about 13-14% over the same year. So, what’s the deal?

I can think of two reasons for why dartboarding some stocks from the S&P list was better than buying an index fund:

  1. Survivalship bias. The stock list doesn’t include dogs that were in the list a year ago, but which were dropped because they died or floundered.
  2. Weighting. The S&P 500 average is weighted. So, perhaps the stocks with high weights did less well than those with low weights. The dartboard picks randomly, so it’s relatively skewed by better stocks.

And, maybe both of these factors were the cause of the results.

I ran the script over a period of time last year when the S&P 500 dropped. March 7 through April 28th of last year. (The script is told next-day dates.)

From: 8-Mar-05
To:   29-Apr-05
Multiplier: 7.02485966319
Percentile Distribution
 1 -86.6 -12.3
 2 -83.9 -11.9
 5 -76.7 -10.9
10 -70.5 -10.0
15 -68.2  -9.7
20 -65.3  -9.3
30 -60.6  -8.6
40 -57.8  -8.2
50 -52.7  -7.5
60 -48.3  -6.9
70 -41.8  -5.9
80 -37.6  -5.3
85 -32.7  -4.7
90 -29.7  -4.2
95 -25.8  -3.7
97 -24.7  -3.5
98 -21.3  -3.0
99 -12.9  -1.8

This is a closer match to the S&P 500’s average loss of the time, 6.7%, which is how a dartboard in the 6x percentile did. This helps the argument that dartboarding a market average has the effect of magnifying the swings. But, if that were so, then it seems like it would be possible to arbitrage the differences in volatility ‘tween a market average and a dartboard of the average. And, if that were the case, then that arbitrage opportunity would have long been taken (since it’s not exactly rocket science).

Anyway, here are the results from a run over a similar date period, but over which the real average was pretty much unchanged:

From: 3-Feb-05
To:   13-Apr-05
Multiplier: 5.29305135952
Percentile Distribution
 1 -22.9  -4.3
 2 -22.6  -4.3
 5 -19.1  -3.6
10 -16.9  -3.2
15  -8.6  -1.6
20  -6.6  -1.2
30  -3.0  -0.6
40  -0.2  -0.0
50   1.1   0.2
60   5.4   1.0
70   9.0   1.7
80  13.3   2.5
85  14.2   2.7
90  16.3   3.1
95  21.0   4.0
97  22.2   4.2
98  23.8   4.5
99  32.3   6.1

Just to give a gut feel for how accurate the numbers are, let’s run that script again:

From: 3-Feb-05
To:   13-Apr-05
Multiplier: 5.29305135952
Percentile Distribution
 1 -28.6%  -5.4%
 2 -28.2%  -5.3%
 5 -23.8%  -4.5%
10 -15.2%  -2.9%
15 -11.6%  -2.2%
20 -10.8%  -2.0%
30  -6.3%  -1.2%
40  -1.5%  -0.3%
50   2.8%   0.5%
60   5.0%   0.9%
70   8.4%   1.6%
80  11.7%   2.2%
85  16.5%   3.1%
90  21.2%   4.0%
95  22.8%   4.3%
97  27.1%   5.1%
98  27.4%   5.2%
99  32.2%   6.1%

OK. ‘Bout the same. So a hundred portforlios works ok over a fairly short period of time. Hmmm. Just for fun, let’s try 500 portfolios instead of 100:

From: 3-Feb-05
To:   13-Apr-05
Multiplier: 5.29305135952
Percentile Distribution
 1 -35.9%  -6.8%
 2 -27.3%  -5.2%
 5 -20.2%  -3.8%
10 -16.2%  -3.1%
15 -13.3%  -2.5%
20 -11.3%  -2.1%
30  -6.6%  -1.3%
40  -2.8%  -0.5%
50  -0.0%  -0.0%
60   4.0%   0.8%
70   8.0%   1.5%
80  11.7%   2.2%
85  14.6%   2.8%
90  18.1%   3.4%
95  23.4%   4.4%
97  25.4%   4.8%
98  27.5%   5.2%
99  33.1%   6.3%

Well, it might be a bit smoother and have better numbers out at the ends.

So, now let’s try 30 darts rather than 15 (you can see I’m improving the print-out with each run of this script):

From: 3-Feb-05
To:   13-Apr-05
Portfolio size: 15
Darts: 500
Multiplier: 5.29305135952
Percentile Distribution
 1 -30.6%  -5.8%
 2 -24.0%  -4.5%
 5 -20.4%  -3.8%
10 -16.0%  -3.0%
15 -13.3%  -2.5%
20  -9.8%  -1.8%
30  -6.6%  -1.2%
40  -2.9%  -0.6%
50   0.2%   0.0%
60   3.1%   0.6%
70   6.6%   1.2%
80  11.0%   2.1%
85  13.4%   2.5%
90  16.8%   3.2%
95  22.4%   4.2%
97  25.4%   4.8%
98  27.3%   5.2%
99  31.2%   5.9%

Which, as one might expect, pulls the extremes in a bit, but doesn’t change anything else, really.

So, anyway, it would have been handy if I’d had a list of S&P stocks at the starting date. And, the historical data for each.

Off hand, I can’t think of a way to get portfolio_track.py to quickly print out what percentile of dartboard investors you’d be in. Since the width of the bell curve of those dartboarders is probably a function of the number of darts they throw, I guess that portfolio_track.py would simply need to use a formula that takes the number of stocks the real portfolio has in it.

Just to validate this thinking, here is another run with the dart count (the portfolio size) set to 400:

From:           6-Feb-06
To:             21-Apr-06
Portfolio size: 400
Darts:          500
Multiplier:     4.93521126761
Percentile 1-Year From-To Distribution
 1         21.8%    4.4%
 2         22.0%    4.5%
 5         22.5%    4.6%
10         22.9%    4.6%
15         23.2%    4.7%
20         23.5%    4.8%
30         23.9%    4.8%
40         24.3%    4.9%
50         24.6%    5.0%
60         24.9%    5.0%
70         25.2%    5.1%
80         25.6%    5.2%
85         25.8%    5.2%
90         26.1%    5.3%
95         26.7%    5.4%
97         27.0%    5.5%
98         27.1%    5.5%
99         27.3%    5.5%

Anyway, I’ll run portfolio_track.py on the latest bunch of stocks I bought (which I haven’t felt particularly good about, and which weren’t bought in a single day, but we’ll ignore little dings which in this particular case make me look a hair better against the dartboard).

Symbol    1yrGain  Market-relative
---------------------------------------
ALDA        89.8%    70.1% ~ ^GSPC
BBBY        41.4%    22.8% ~ ^GSPC
EGY         66.6%    43.7% ~ ^GSPC
FORD        10.7%    -7.8% ~ ^GSPC
GTW        -61.7%   -80.2% ~ ^GSPC
JAKK       151.0%   132.5% ~ ^GSPC
KSWS       -16.6%   -35.1% ~ ^GSPC
MTEX       181.3%   162.8% ~ ^GSPC
OPTN        24.8%     6.3% ~ ^GSPC
WINS       -61.6%   -83.0% ~ ^GSPC
---------------------------------------
^GSPC       19.3%
---------------------------------------
Absolute:   42.0%
Relative:            22.7% ~ ^GSPC

Well, now, the S&P went up pretty good during that time. Let’s dartboard it, roughly:

From: 6-Feb-06
To:   21-Apr-06
Portfolio size: 10
Darts: 2000
Multiplier: 4.93521126761
Percentile Distribution
 1 -20.1%  -4.1%
 2 -12.1%  -2.4%
 5  -1.6%  -0.3%
10   4.2%   0.9%
15   8.9%   1.8%
20  11.3%   2.3%
30  16.2%   3.3%
40  20.0%   4.1%
50  23.6%   4.8%
60  27.5%   5.6%
70  31.5%   6.4%
80  36.0%   7.3%
85  39.2%   7.9%
90  43.3%   8.8%
95  51.6%  10.5%
97  58.6%  11.9%
98  66.4%  13.4%
99  84.7%  17.2%

Apparently, to feel good, I gotta get deep in the 90’s. 🙂

Which gets in to another subject – can the scientific method be used internally between selves? In fact, is it? … ‘Nother time. …

All this wandering makes something rather clear: If you’re investing in a market average, you’re effectively saying:

  • you believe you are somewhere under the 50th to 60th percentile of investers (assuming that the difference ‘tween results of a 50 percentile investor and a 60 is not worth the effort).
  • you don’t know where you stand in the percentiles – and want to assume that you’re as likely to be on the bottom as on the top.
  • you figure that you are all over the map, depending upon time and circumstance
  • there is no percentile ranking of investors. Everyone is the same.

Let’s assume that there is a ranking. How do you find your current position?

If picking stocks took no time and transactions were free, then it would make sense to dartboard a boatload of stocks (say 1 share each). Then, if you find yourself above the 60th percentile, start exchanging the stocks you most dislike for the ones you most like. Do that until you drop significantly in the rankings. That’s when you’ve reached your Peter-Principle level of incompetence.

Alternative that doesn’t require infinite time and free transactions: Buy a few shares of one stock and a lot of a market average “stock”. When you go above the 60th percentile with your picked stock(s), sell the market-average and buy a picked stock. Hill-climb the results of your total portfolio as you would using the previous method.

The hill-climb method you would use, by the way, seems to be identical to a method you would use to trim a boat with no tell-tales or instruments while sailing up-wind in shifting winds.

CRC / Checksums Again

Shudda noted that the method of doing additive checksums by look-up table values makes for some pretty dumb, fast code able to compute things like 256 bit checksums. Just concatenate 16 16-bit checksums, each computed using a different set of tables. Or whatever.

Also thinking about computing a rolling checksum or incremental checksum:

I gather the standard method of distinguishing the difference between, for instance, “xy” and “yx” (which a normal checksum considers equal) is to sum the sum in a separate super-sum. … The final checksum is a combination of the sum and super-sum. The super-sum effectively indexes the position of each byte by shifting the byte’s value up in the super-sum as a function of how far back the byte is in the data stream. Pulling the byte’s effect out of the super-sum is easy: subtract the byte’s value times the length of the rolling data block. Let’s presume the byte-value multiple is precomputed.

Off hand, I don’t see anything wrong with wrapping the sums something like this (Warning: vanilla C carry bit kludge ahead.):

byte           b
uint32         sum_of_sums, sum

sum         += table[b]
sum          = (sum         >> 16) + (sum         & 0xffff)
sum_of_sums +=  sum
sum_of_sums  = (sum_of_sums >> 16) + (sum_of_sums & 0xffff)

Yes, in this 16-bit example if you have more than 64k bytes of data you could have a problem, but you’d have a problem if the overflow goes to the bit bucket. And, anyway, you’d probably want to use 31 bits or 32 bits in a real application, giving you a 2-4 gig of data without overflow. Etc.