Rube Goldberg is alive and well in the gold Honda

A few months back, the gold Honda’s cassette deck died.

I listen to audio books from KCLS in the car. Romances, westerns, and others requiring no thinking of any sort.

So, the dead cassette deck was a very serious thing.

What to do?

Well, logic says that throwing less than a hundred bucks at Fry’s would solve the problem.

But …

Such an opportunity!

Inspiration, and, if I may humbly say so, a stroke of genius, made two things clear:

  1. Old things were lying around the house, doing nothing. (not meaning the Honda’s owner, mind you.)
  2. The gold Honda was, how shall we say it, not worth the C note. Let’s examine the evidence:

    Gold Honda Odometer


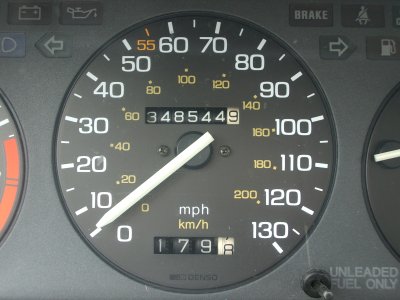
So, here are pictures of the simple, no-cost replacement for that broken cassette deck:

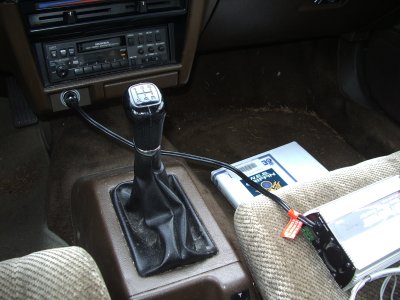
First, the equipment must be plugged in to the lighter socket:

Gold Honda Power Cable

And, for the parts we have:

Gold Honda Cassette Deck and Friends

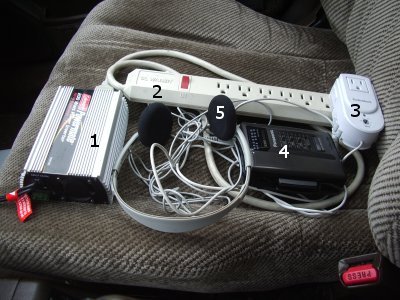
Let’s review this simple arrangement:

  1. Power – a good inverter comes in handy. Producing plenty of 120v power from the cigarette lighter socket with, uh, some little fan noise. … OK, a lot of fan noise. But, hey, it’s in a car, so who can hear it? Anyway, it feeds to the…
  2. Power strip – you never know what you might want to plug in to the car, after all. (I tried a refrigerator once. It didn’t work.) And since we’re talking about sophisticated electronics here, you cannot have too many over-current breakers in the circuit. Plugged in to the power strip is a …
  3. DC converter – We need DC power, so an old Radio Shack universal AC-DC converter does the trick. It powers …
  4. The cassette deck itself – We can’t forget this item, can we? Luckily, stashed away in a forgotten box were a couple of these old things – probably older than the car, this one is. It plays the audio to …
  5. Headphones – Finally, there must be a way to hear the audio.

But wait!

There’s more!

This picture was taken after Scott borrowed the FM transmitter. Too bad. That noisy, battery-eating device was truly the perfect way to complete the circuit back to the car’s radio.

And, too bad this picture does not show the battery-powered, noise cancelling headphones that should be used in such an advanced audio system as this one. They are in the glove compartment.

So, kids, if your car’s sound system fries, just come to us here at Kludge Central. We can get you going for double anything you’ll pay on the street.

Describing Stock Price Histories

How could stock price histories be described?

Well, one thing that graphs of relative price history show is that their changes are “hairy”. Lots of zeros and lots of quick up/downs. It’s like there is energy stored up, and when it releases, there are sudden jerks. And one jerk leads to another.

Rather like two pieces of rusted metal trying to slide along each other. Do continental plates make the same kind of noise? Would they if they were on a infinite, flat-plane planet? For that matter, isn’t a sphere a good physical model to use for self-referential systems?

Do the jumps represent “the market” correcting an out-of-kilter situation? If so, then that would imply that there is an information bottleneck. When the backed up information is released, the market responds quickly…. implying that the market can respond faster than information is being made available. What would things look like if the market were inherently slower to process available information than the rate that such information is made available? Lost information – or, if the two rates were, over time, roughly equal … queuing stuff.

Or, are these changes caused by bad information that is constantly being updated, rightly or wrongly?

Or, is the market simply being noisy in the absense of information – effectively bouncing between widely separated walls that represent what information is actually available? Imagine that the true value of a stock is between 30 and 35. There is no way to know where inside that range it is, though. Wouldn’t the best market behavior be to bounce against both 30 and 35?

Is there a “true value” of a company?

This all sounds like technical analysis stuff. Without any predictive power.

Mountainous Times

Here is a mountain range’s profile:

Fractal Mountain Profile

Or, if you prefer, displayed on a sorta biased log scale:

Fractal Mountain Profile


The mountain range is generated using a relatively standard fractal mountain range method:

  1. Starting with the whole range as a segment, divide the segment in half and move the middle of it up or down randomly from where it would be if it were on a line ‘tween one end of the segment and the other.
  2. Recursively do the two half-segments.
  3. But … pick smaller and smaller random movements as the segments get smaller.

And, here’s WDC’s (Western Digital) daily price history, similarly displayed:

WDC daily price profile

And, on a log scale:

WDC daily price profile

WDC’s price history is nice to work with because it is not very swamped by market movements.

Now, what do relative daily changes look like for both:

Mountain range:

Fractal Mountain Changes

WDC:

WDC Changes

Here are the histograms of the changes:

WDC Changes Histogram

Fractal Mountain Changes Histogram

By contrast, here are the same pictures for MMM (3M) after its price has had the Dow Jones Industrail Average (of which it is a part) factored out:

MMM Minus Dow Jones Daily Prices

MMM Minus Dow Jones Daily Prices

MMM Minus Dow Jones Changes

MMM Minus Dow Jones Changes Histogram

And, here are the pictures for the Dow Jone Industrials, themselves:

Dow Jones Daily Prices

Dow Jones Daily Prices

Dow Jones Changes

Dow Jones Changes Histogram

So, aside from lots of pictures, what’s up?

Well, one thing that sure stood out: Relative changes went in to overdrive in the mountain range where there were valleys. Not nearly so for stocks.

That’s not news, but I’m asking myself some questions:

  1. Does the method I used for making the mountain range make bad mountains? There are notes on the net that suggest that the method I used is not really “correct”. Anyway, they sure look like mountains.
  2. Which way is it with real mountains?
  3. Is the eye normally fooled by mountain range profiles that have, in effect, oversized boulders in the valleys?
  4. Or, is the eye fooled in to thinking that an oversized-bumps-in-valleys profile is that of a reasonable mountain range?
  5. What about the ear? Nose? Etc?

Anyway, this particular difference ‘tween fractal mountains and stock prices is probably at least one reason why Mandlebrot turned to multi-fractals to try to generate values that look like stock price histories.

One thing I may fool around with: modulating the random up/down-ness of mid-points not by the size of the segment, but by another mountain range. That’s kind of working backward, as the next thing to do would be to modulate the modulator … and so on. Or, put another way, does the profile of the uncertainty of “the market” with respect to a stock look like a mountain range? And so on.

Anyway, again, this is getting a bit off the track. One good thing: if a simulation’s operations are underlain by intrinsic values that are mountain range data, and if the simulation creates stock-history-like data, then that’s a good thing. Presumably, pieces of the simulation’s logic can be turned on and off and it can be found which bits of logic are critical and which are not. Which is the idea.

Random Rockies

Here’s an idea for a science fiction story: Somebody finds out that some part of the world has been created using a known random number generator. A predictable generator, that is.

Harkening back to a previous post, for instance, let’s say that someone notices that a simple program using a standard modulo-multiplication random number generator can create an almost exact profile of the Rocky Mountains, looking west from the Great Plains.

This must have been done already in plenty of ways, though I’d not know, not having read much sci-fi in a long time.

How many MIPS does the Earth’s DNA crank

I’ve often wondered how much processing power the Earth’s DNA has. In a sense, genetic evolution seems to be a search function, not unlike a nervous system, always seeking to represent, in some transformed way, a match to its outside reality.

Hmmm. If there were some reasonable way to measure “MIPS” in a broad sense, then I imagine that some of the parallels ‘tween nervous systems and genetic evolution would be clearer than they are now.

Anyway, thinking of genetic evolution as being a “brain” brings up the question: Is it self-aware?

Which brings up the question of: What the heck does “self-aware” mean?

Or, another question: Does it, genetic evolution, that is, have intention? (I’m thinking that anything that is “self-aware”, whatever that means, probably has motives of some sort. Maybe not true, of course, but it sure feels ok to think so.)

Etc.

It’s the “etc” part that’s fun.

Odd thing

I got curious whether stock price behavior might be a consequence of some combination of buyers and sellers who had access to different information. Naturally, that sounds like a job for a simulation. Simulations are always easier than thinking. 🙂 And, they are sure better to learn with.

Anyway, somehow that got me looking at real stock market prices (thank you, Yahoo closing price history downloads). If I’m gonna simulate stock pricing, then it would be nice to know what the real thing looks like.

So far:

1) I pinged an email address on a web page to find out about available tools to detect whether artificial stock pricing looks like the real thing. Bust. He said his stuff was just some numbers he didn’t know about. The web site was about fractal stuff – including Mandlebrot’s stock market work.

2) When I graphed the histogram of relative changes to closing prices for some stocks and market averages, the older stocks had a curious oddity in them looking like this:

Histogram of relative changes to MMM daily closing price over many years

Note the crater at the center.

The crater seems to be caused by a combination of:

1) The numbers I’m using are normalized for stock splits – so old closing prices can be really small.

2) The numbers are rounded to the penny.

3) Before a few years ago, the smallest change in a price was a 1/16th (or 1/8th?) of a buck. If the resolution of the histogram is much smaller than that amount, then all the changes under 8 cents get rounded to zero – and are included in the tall spike at zero.

Anyway, I messed around, explicitely not using multifractals and variable time. And got some numbers that, when graphed in various ways aren’t too different looking from real stocks.

Time to press on and leave this distraction.

Ah. One thing thinking about a simulation does: It makes real clear what is pointed out (but often buried) in available information: The basis of value of all stocks is dividends. And, the ideal thing is to buy a stock when it’s worth pennies, and get a decent dividend when the stock is worth a lot. If you buy a stock for a buck and it goes to $100 and pays a 4% dividend, then you’re getting a pretty good payback on your buck even though the stock goes back to zero value in the end – which you want it to do from that $100 in a single day, of course. 🙂

Anyway, my plan is to create a bunch of stocks with a real value (dividends) profile that look like that mountain range. Then give some actors differing knowledge and/or disinformation of the future and let ’em go at it in a market.

And see what happens.